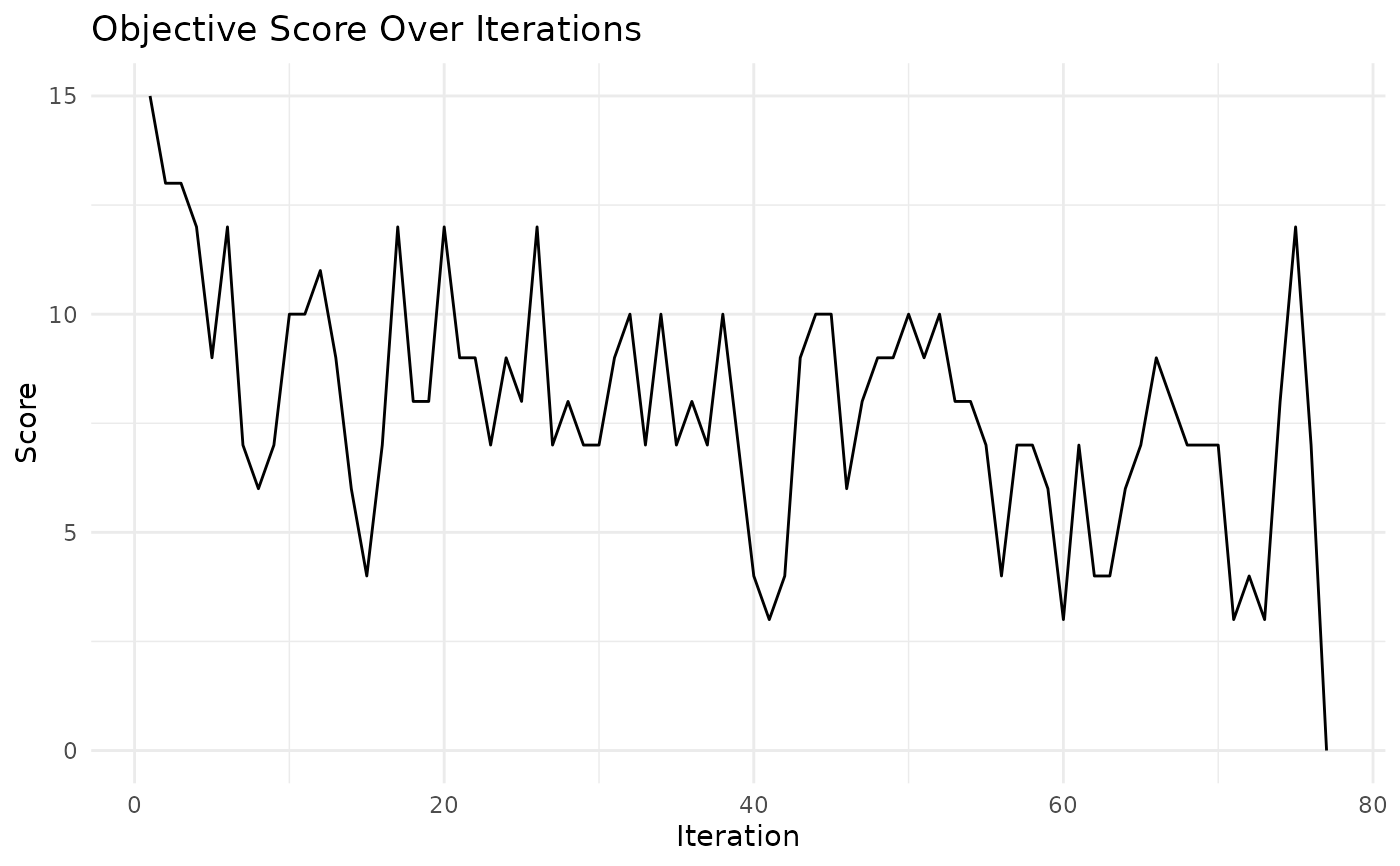
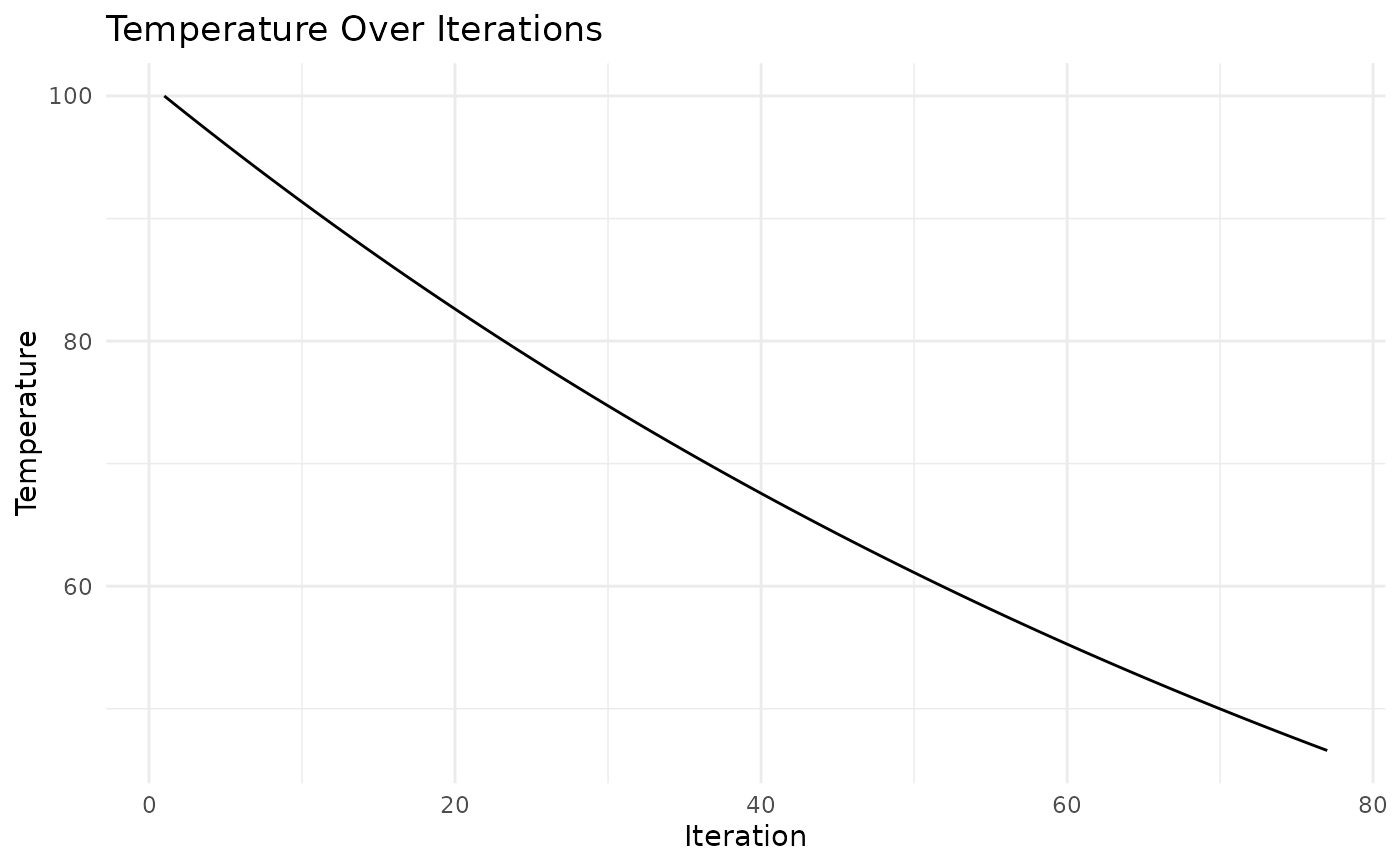
Creates two plots showing the progression of the optimization:
Objective score over iterations
Temperature decay over iterations
Value
No return value; prints two ggplot objects showing:
Progress of the objective score
Cooling schedule (temperature decay)
Examples
# Create a simple design
df <- data.frame(
  row = rep(1:3, each = 3),
  col = rep(1:3, times = 3),
  treatment = rep(LETTERS[1:3], 3)
)

# Optimise the design
result <- speed(df, "treatment")
#> row and col are used as row and column, respectively.
#> Optimising level: single treatment within whole design
#> Early stopping at iteration 76 for level single treatment within whole design

# Plot optimization progress
plot_progress(result)