Generate plots for designs generated in speed
Usage
autoplot(object, ...)

# S3 method for class 'design'
autoplot(
  object,
  rotation = 0,
  size = 4,
  margin = FALSE,
  palette = "default",
  row = NULL,
  column = NULL,
  block = NULL,
  treatments = NULL,
  legend = FALSE,
  ...
)
Arguments
- object
An experimental design object generated from
speed().- ...
Arguments passed to methods.
- rotation
Rotate the x axis labels and the treatment group labels within the plot. Allows for easier reading of long axis or treatment labels. Number between 0 and 360 (inclusive) - default 0
- size
Increase or decrease the text size within the plot for treatment labels. Numeric with default value of 4.
- margin
Logical (default
FALSE). A value ofFALSEwill expand the plot to the edges of the plotting area i.e. remove white space between plot and axes.- palette
A string specifying the colour scheme to use for plotting or a vector of custom colours to use as the palette. Default is equivalent to "Spectral". Colour blind friendly palettes can also be provided via options
"colour blind"(or"color blind", both equivalent to"viridis"),"magma","inferno","plasma","cividis","rocket","mako"or"turbo". Other palettes fromscales::brewer_pal()are also possible.- row
A variable to plot a column from
objectas rows.- column
A variable to plot a column from
objectas columns.- block
A variable to plot a column from
objectas blocks.- treatments
A variable to plot a column from
objectas treatments.- legend
Logical (default
FALSE). IfTRUE, displays the legend for treatment colors.
Examples
# Create a design with blocks
df <- data.frame(
row = rep(1:6, each = 4),
col = rep(1:4, times = 6),
treatment = rep(LETTERS[1:8], 3),
block = rep(1:3, each = 8))
# Optimise while respecting blocks
result <- speed(df,
"treatment",
swap_within = "block",
seed = 42)
#> row and col are used as row and column, respectively.
#> Optimising level: single treatment within block
#> Level: single treatment within block Iteration: 1000 Score: 2.571429 Best: 2.571429 Since Improvement: 543
#> Level: single treatment within block Iteration: 2000 Score: 2.571429 Best: 2.571429 Since Improvement: 1543
#> Early stopping at iteration 2457 for level single treatment within block
# Plot the design with block boundaries
autoplot(result)
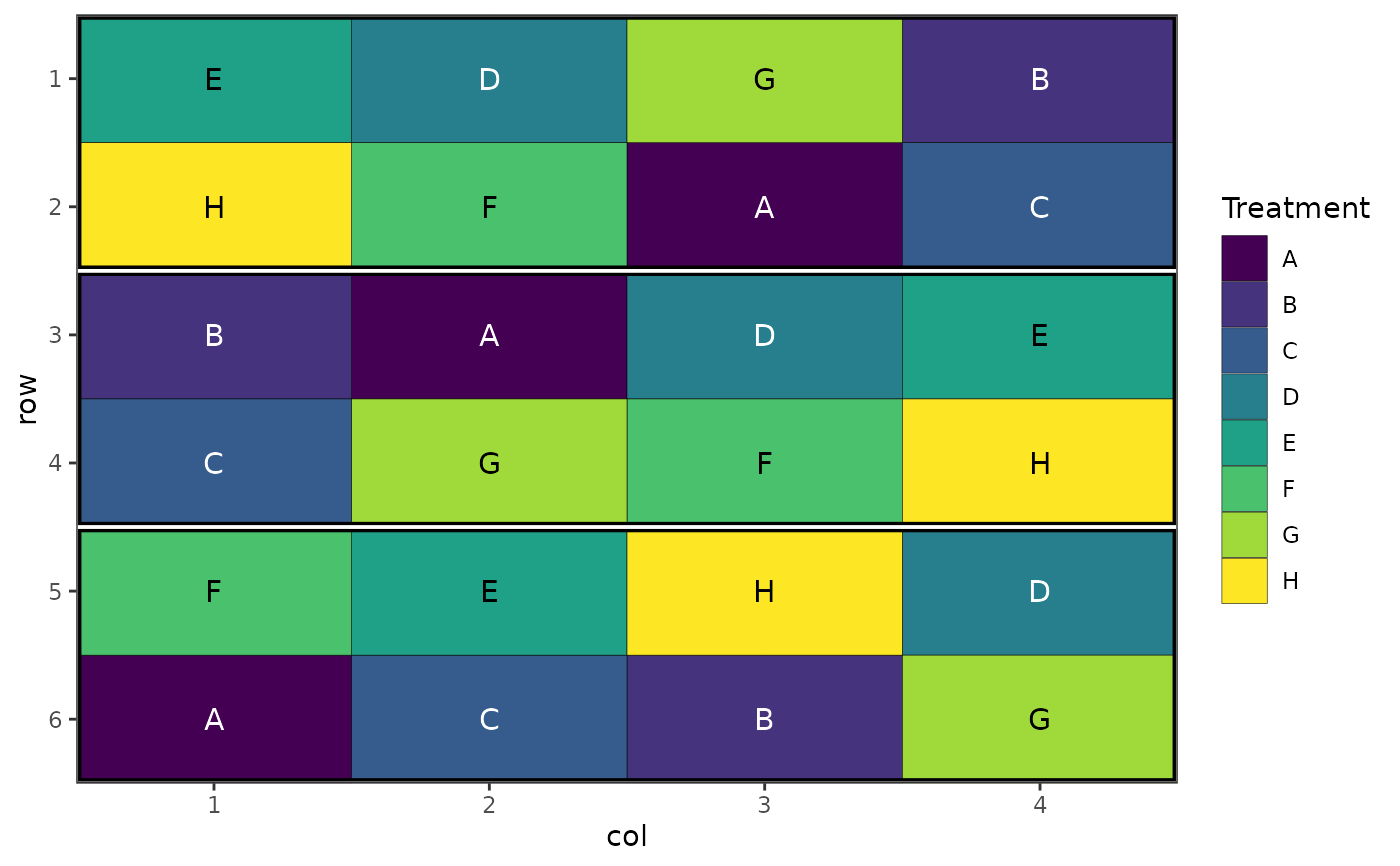
 # Show legend
autoplot(result, legend = TRUE)
# Show legend
autoplot(result, legend = TRUE)
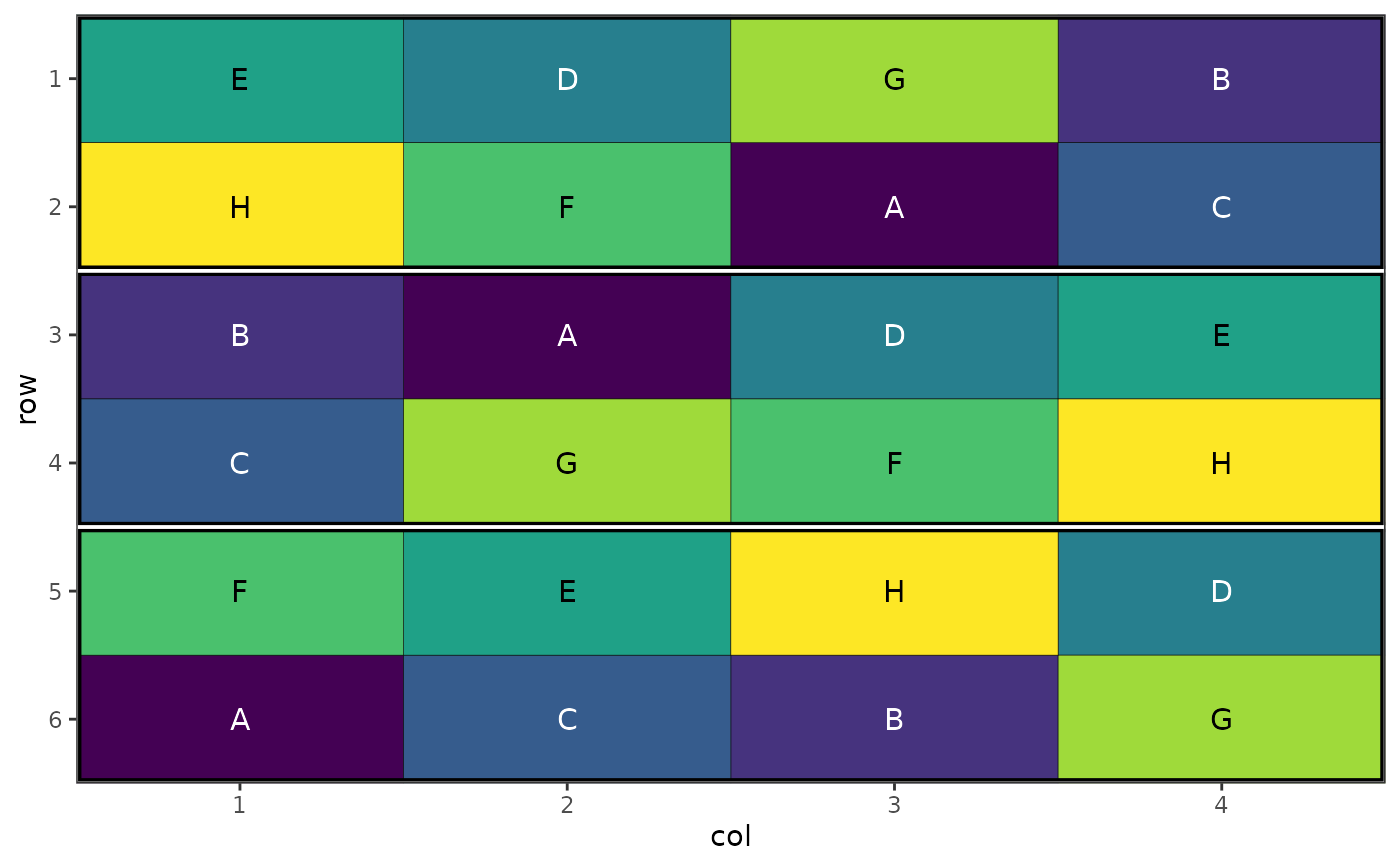
 # Colour blind friendly colours
autoplot(result, palette = "colour-blind")
# Colour blind friendly colours
autoplot(result, palette = "colour-blind")
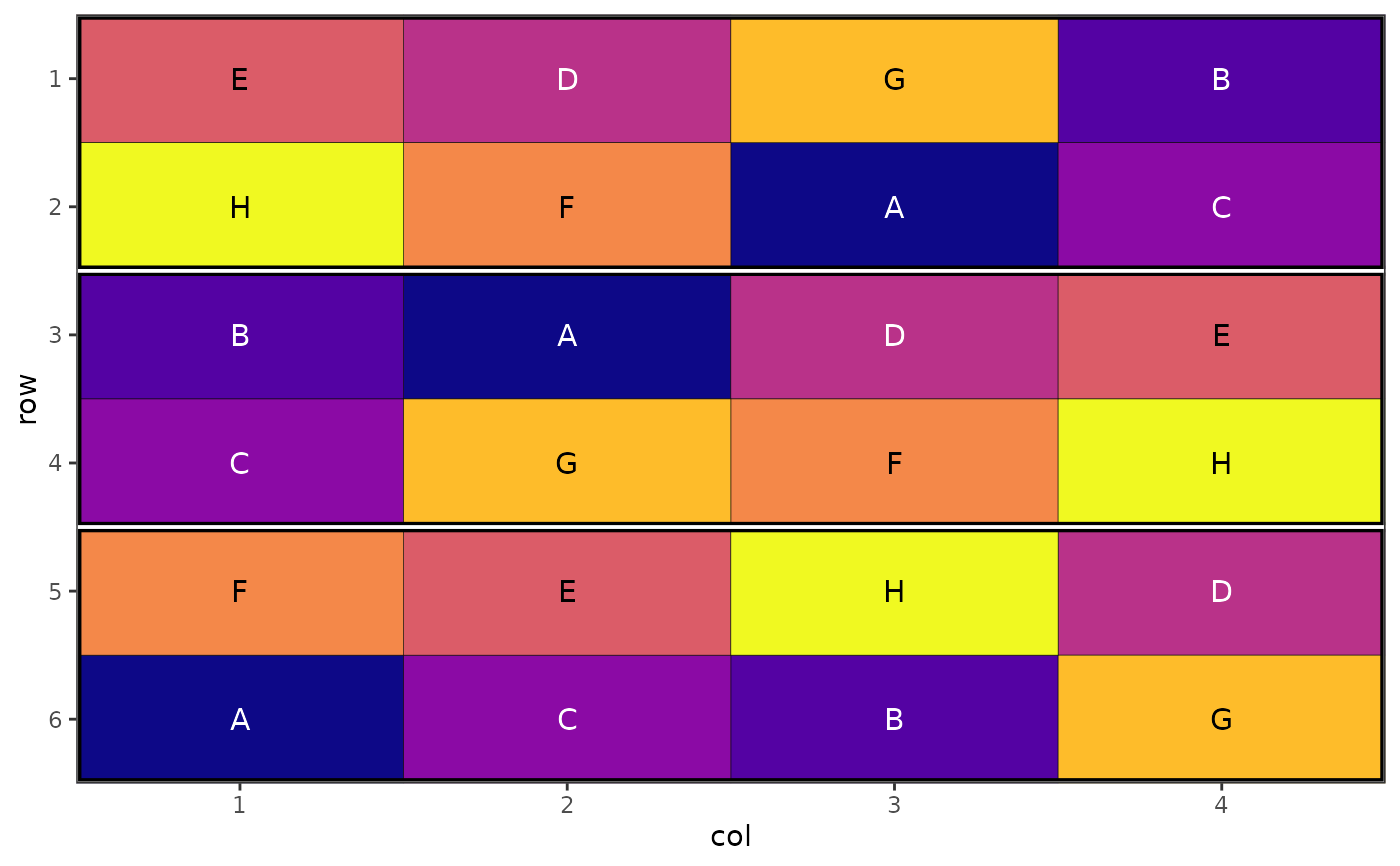
 # Alternative colour scheme
autoplot(result, palette = "plasma")
# Alternative colour scheme
autoplot(result, palette = "plasma")
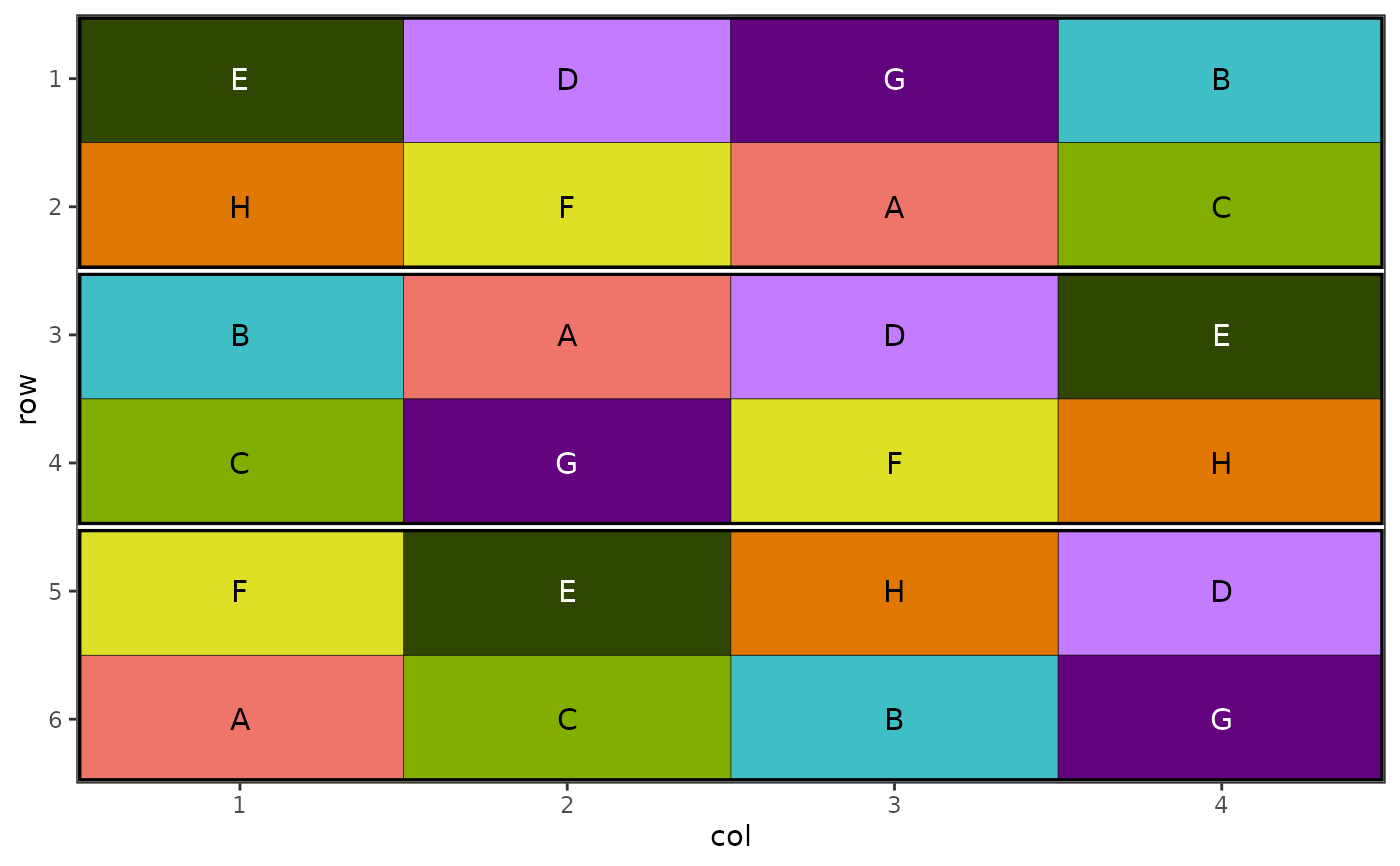
 # Custom colour palette
autoplot(result, palette = c("#ef746a", "#3fbfc5", "#81ae00", "#c37cff",
"#304702", "#dde024", "#630380ff", "#df7700"))
# Custom colour palette
autoplot(result, palette = c("#ef746a", "#3fbfc5", "#81ae00", "#c37cff",
"#304702", "#dde024", "#630380ff", "#df7700"))