Easily navigate and retrieve weather datasets for anywhere in Australia!
The weathervane package aids researchers in retrieving Australian weather and climate data (sourced from SILO and the Bureau of Meteorology) to incorporate into statistical analyses of agronomic experiments,
plant-breeding trials and other research.
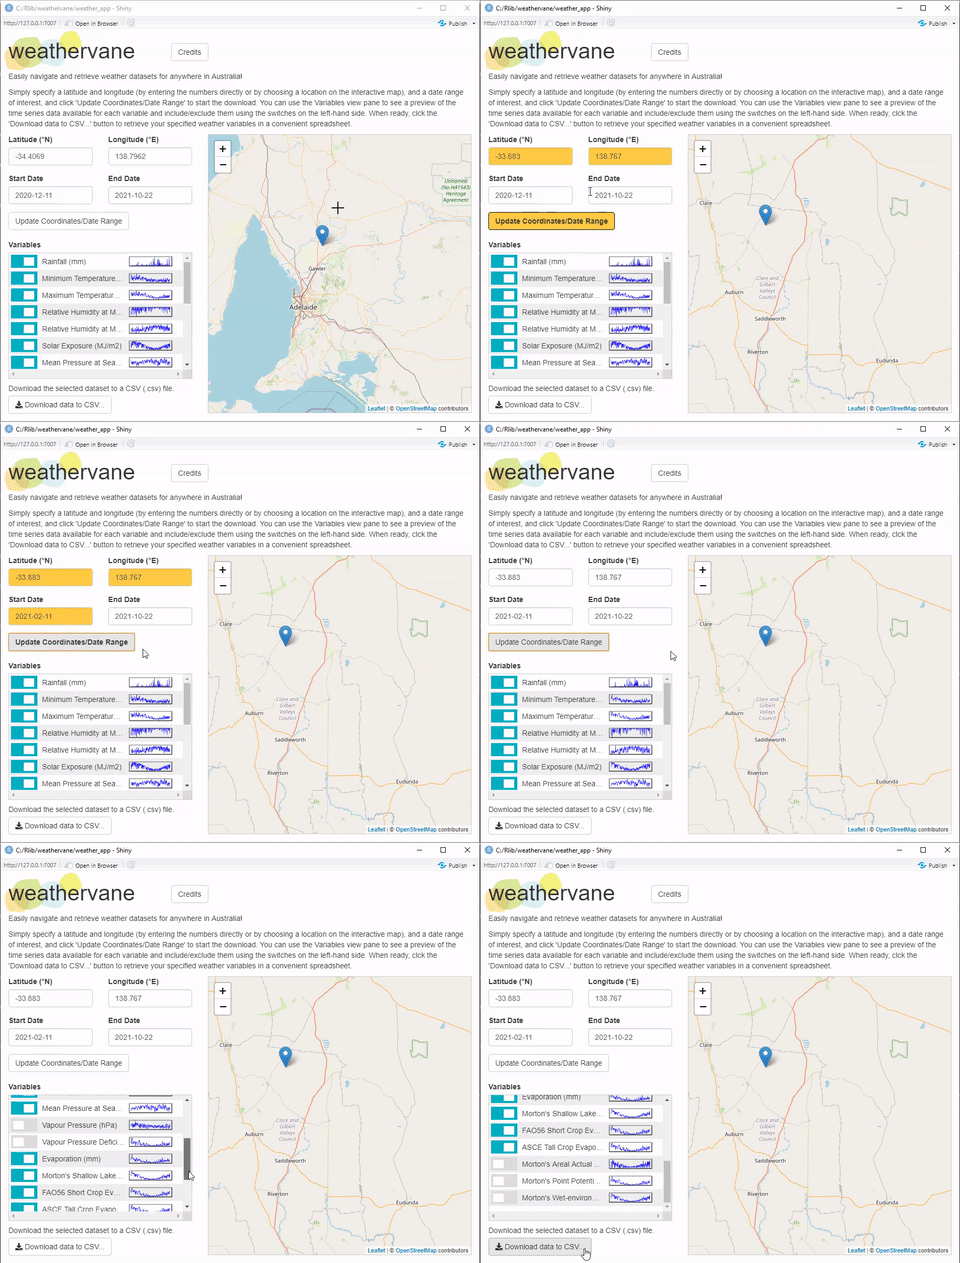
This R package includes a simple and user-friendly Shiny App for retrieving weather data, complete with an interactive map, data previews and CSV spreadsheet export.

Alternatively, load the library and use the weather data retrieval functions directly in your statistical analysis workflow.

Installation
Run the following code on your R console to install this package:
if(!require("remotes")) install.packages("remotes")
remotes::install_github("biometryhub/weathervane", upgrade = FALSE)
Using the package
Load the package and start using it with:
Using the library functions directly
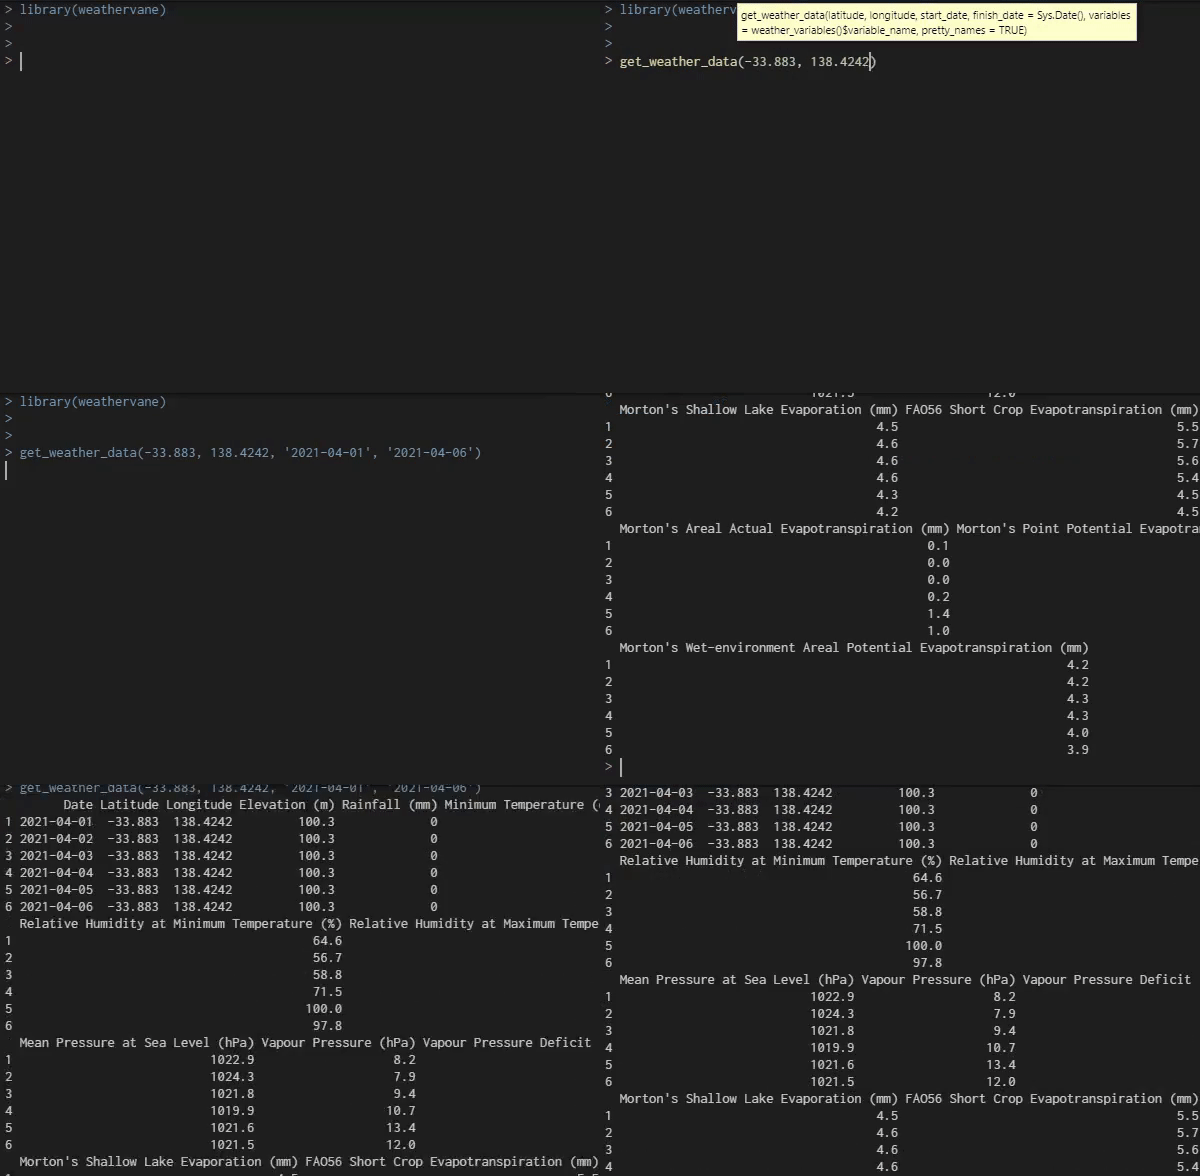
Invoke get_weather_data together with a latitude and longitude (in decimal degrees Northing/Easting, respectively), and a start date (as a Date object or a ‘YYYY-MM-DD’ string). Optionally, specify an end date too; by default, this function will grab all data up to the most recent possible date. The function returns the weather data in a neat data frame.
Example: Here we grab a week’s worth of weather data for the Adelaide CBD (-34.9285°N, 138.600°E) from 01/01/2021 to 07/01/2021 inclusive:
get_weather_data(-34.9285, 138.6007, '2021-01-01', '2021-01-07')
By default, all possible weather variables are returned. Should you wish to fine-tune the selection of variables before they are retrieved from the server, this can be done by specifying the variables individually. (See weather_variables for the variables available and their codes.)
Example: Here we suppose we only want rainfall and maximum temperature data for the Sydney CBD (-33.8688°N, 151.2093°E) for the first week in June, 2020:
get_weather_data(
  latitude = -33.8688,
  longitude = 151.2093,
  start_date = '2020-06-01',
  finish_date = '2020-06-07',
  variables = c('rainfall', 'max_temp')
)
Using the Shiny app
(Note: Requires the shiny, ggplot2, leaflet and R6 packages to be installed locally for the GUI.)
The Shiny app provides a user-friendly front-end to the weathervane library functions, including an interactive map and variable list, and easy export to a CSV spreadsheet format. Load the app from the R console with:
Attribution to SILO/Bureau of Meteorology
The weather datasets currently retrieved by weathervane are curated by SILO, who make them available under a Creative Commons Attribution 4.0 International Licence. Their data is in turn mostly sourced from the Australian Bureau of Meteorology and their weather stations.
Please reference them appropriately in any publications or other research outputs that use the downloaded weather data. See for example:
Credits
The weathervane package and app were developed by Russell Edson and Sam Rogers from the University of Adelaide’s Biometry Hub. It is our hope that the package is useful to Australian researchers in easily retrieving weather data to incorporate into statistical analyses.
Send all bug reports, questions and comments to biometryhubdev@gmail.com or open an issue on GitHub.