Visualise a graphical summary of variables from a data frame
Source:R/summary_graph.R
summary_graph.RdVariables are plotted in different ways according to the number of explanatory variables provided as input.
Arguments
- data
A data frame containing the variables to be plotted.
- response
The response variable to plot.
- exp_var
The explanatory (or grouping) variable(s) to plot. Up to three can be provided.
- resp_units
A string providing units to display on the response variable (y) axis. Will use the empty string by default so axes will have no units by default.
Details
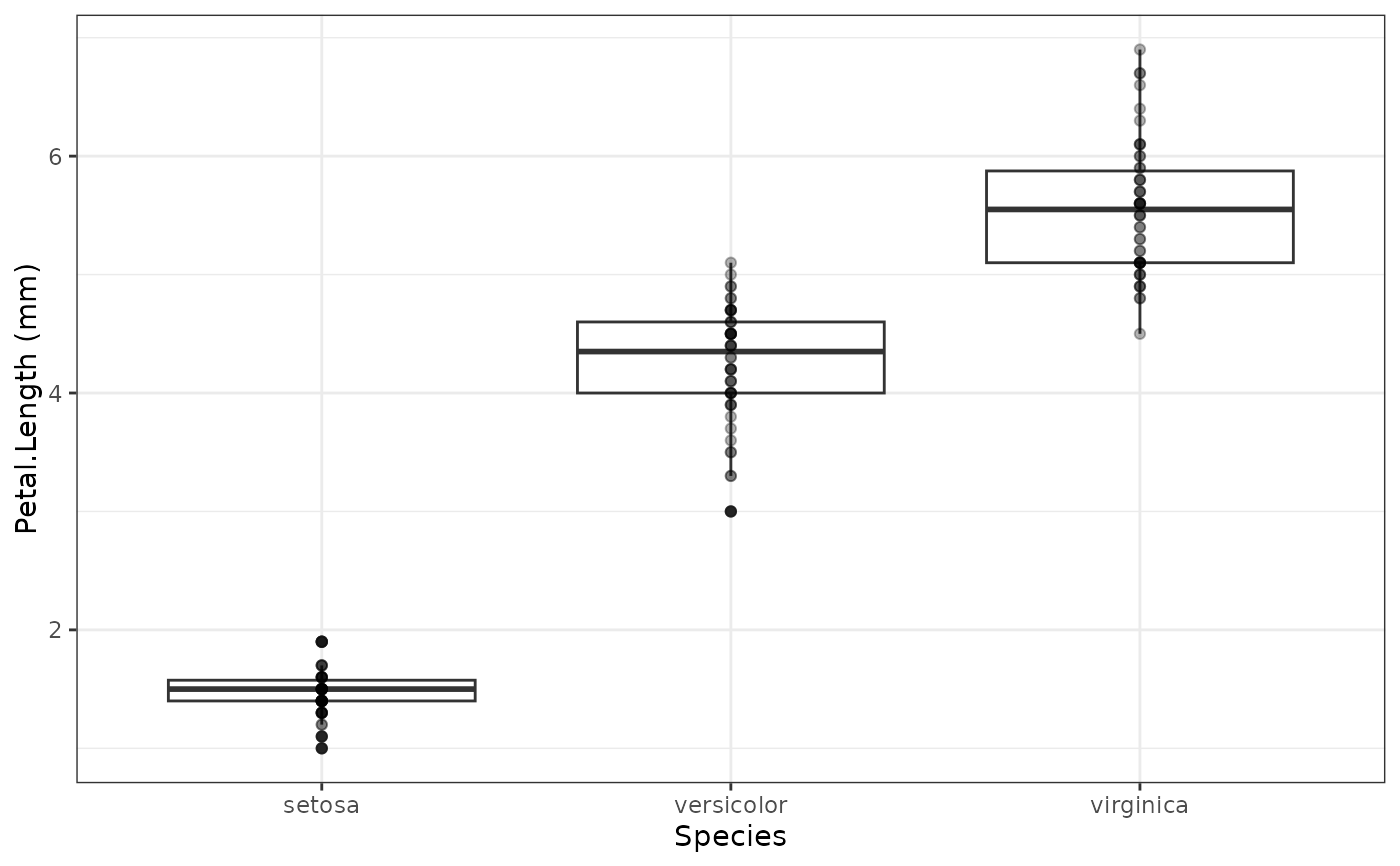
With a single explanatory variable, a boxplot grouped by exp_var is produced.
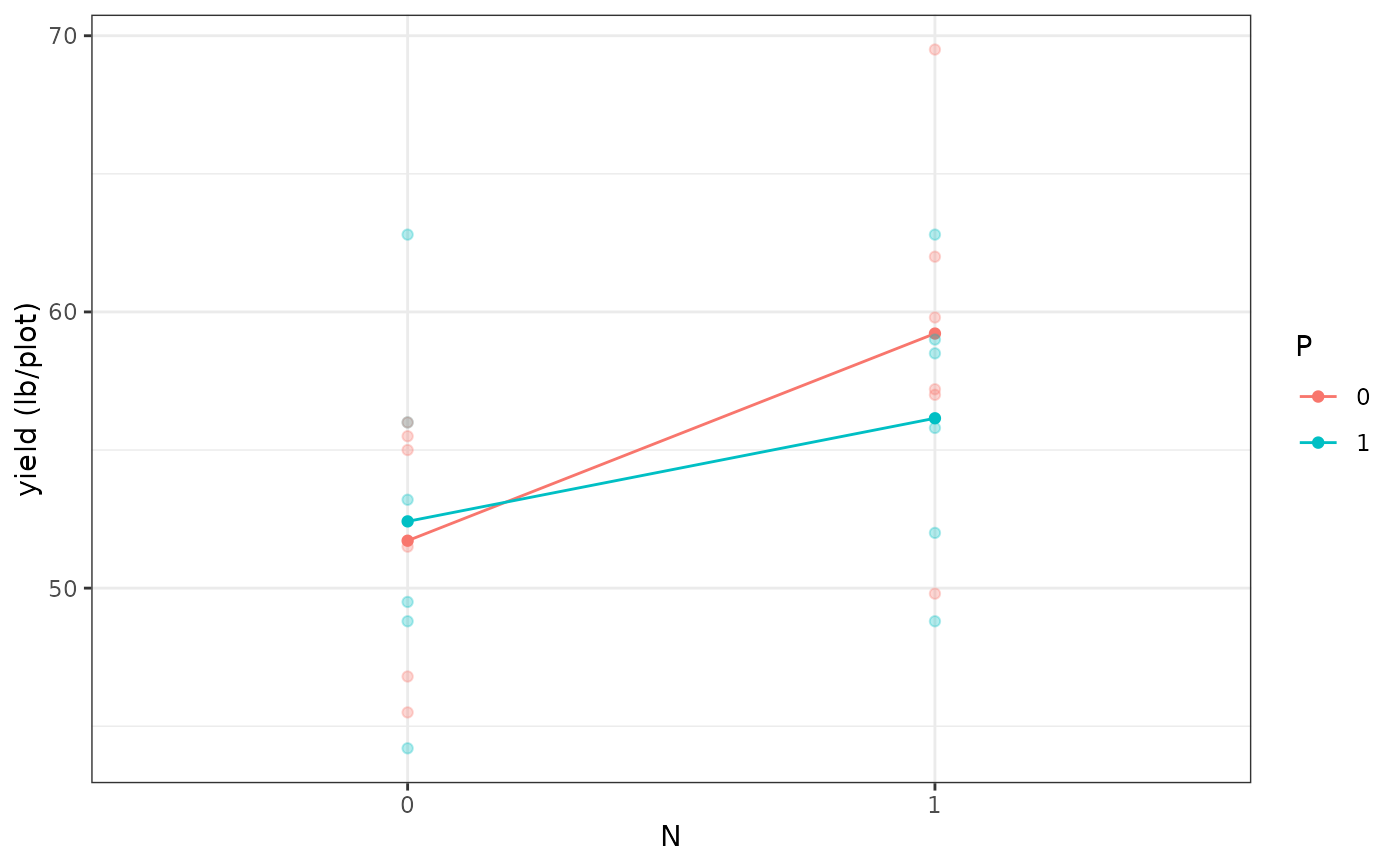
With two explanatory variables, a dot-plot with lines connecting the mean of each
group is produced, with the first element of exp_var used as the x axis variable,
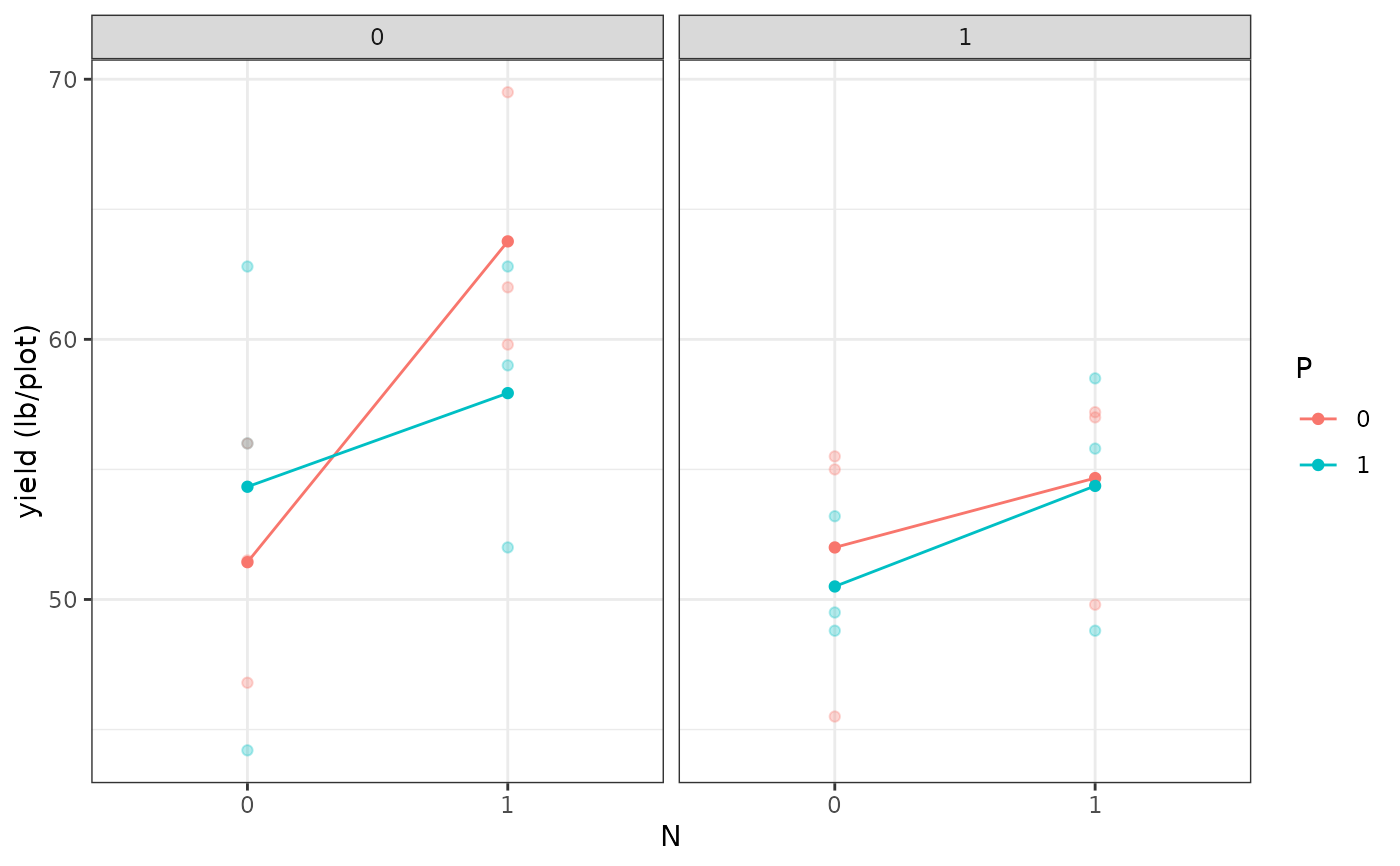
and the second is used to colour the points. Three explanatory variables produces
the same as two, but with the third used to facet the plot.